JetBrains DotCover

Analyze .NET code coverage
JetBrains dotCover is a .NET unit test runner and code coverage tool that integrates with Visual Studio and JetBrains Rider.
Make sure you know to what extent your code is covered with unit tests. dotCover calculates and reports statement-level code coverage in applications targeting .NET Framework, .NET Core, Mono, or Mono for Unity.
Click here to reach us
Unit Tests
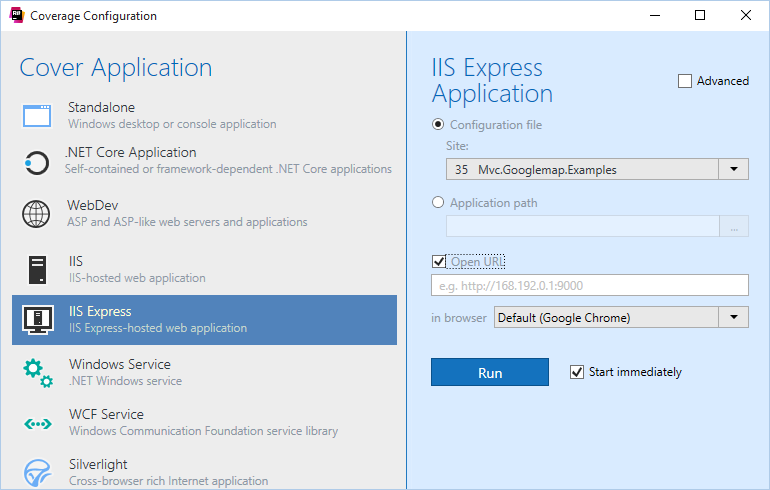
Execute and debug unit tests and run coverage analysis of unit tests in Visual Studio or using the command-line utility. dotCover supports many unit testing frameworks including MSTest, NUnit, xUnit, and MSpec.
Manual test sessions
For manual test sessions, dotCover shows what parts of code were called during the session and which parts were not reached. Using the coverage analysis data, you can easily get to the source code of the tested application.


Detecting hot spots
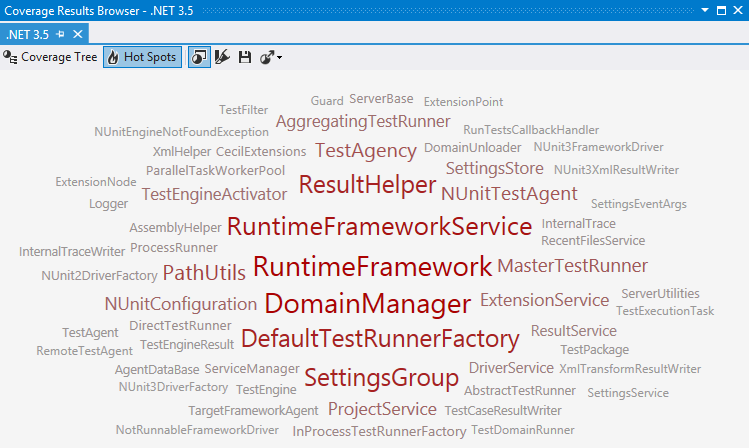
Detect potential risk areas at a glance with Hot Spots view, which shows the most complex methods with the least coverage. Get your coverage analysis off to a good start with an intuitive graphical representation.
Click here to reach us
Seamless integration with Visual Studio and JetBrains Rider
dotCover integrates with Visual Studio and JetBrains Rider, giving you the advantage of analyzing and visualizing code coverage without leaving the code editor. It supports Visual Studio 2010–2017 and JetBrains Rider 2018.2 or later.
Click here to reach us


Continuous testing
dotCover can figure out on-the-fly which unit tests are affected by your latest code changes, and automatically re-runs the affected tests for you. The continuous testing mode can be switched on for any unit test session: this way you can choose which tests you want to run continuously and which to run the traditional way.
Click here to reach us


