
JetBrains DotMemory

FIGHT ALL TYPES OF MEMORY ISSUES
dotMemory allows you to analyze memory usage in a variety of .NET and .NET Core applications: desktop applications, Windows services, ASP.NET web applications, IIS, IIS Express, arbitrary .NET processes, and more.
Click here to reach us
Easily control the profiling process
Use the timeline view to monitor the memory consumed by your application in real time. Collect the info on allocations as you need it.
Collect profiling data
Take snapshots with a single click without stopping your profiling session, add them to compare or browse memory traffic during a particular timeframe.

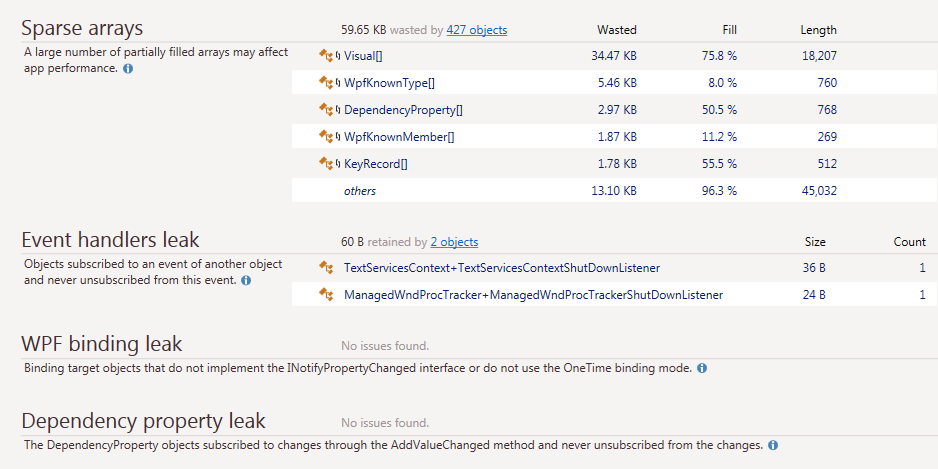
Auto-detect issues
Thanks to the multiple powerful built-in inspections, most common memory issues are detected with a single click, no manual effort required. Just get a snapshot and be guided toward optimizing the memory usage.
Click here to reach us
Analyse deeper
For in-depth analysis, dotMemory offers many different criteria to apply to memory usage data, so you can view the data from thousands of different angles, and drill-down, dice, slice or pivot as you wish.
Click here to reach us

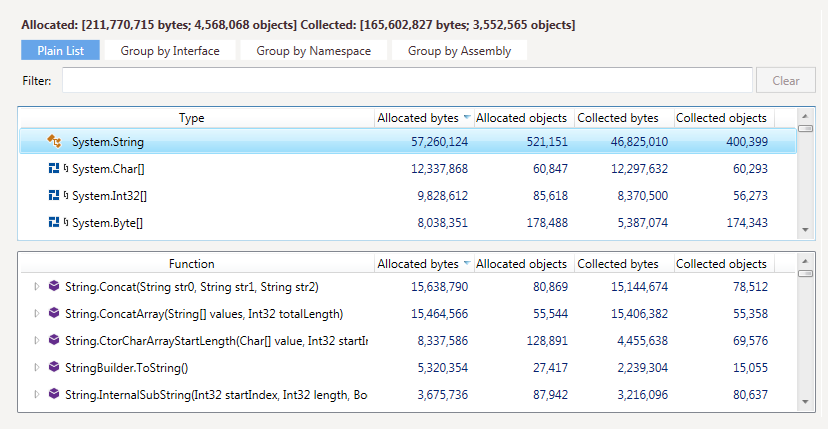
Determine traffic
Analyse memory traffic in a particular timeframe to understand the cause of excessive allocations and garbage collections. Determine how objects were allocated and collected and what methods are behind these allocations.
Click here to reach us
Why dotMemory
Automatic inspections
dotMemory automatically scans your snapshot for the most common types of memory issues. These inspections can be a great starting point in analyzing a snapshot if you’re not sure where to begin.
Multiple views on data
Want to know how the objects relate to each other? What objects they reference and through what fields? Want to know which calls created these objects? No problem! dotMemory has a view for everything.
Visual Studio integration
You can profile the memory usage in your applications right from Visual Studio 2010, 2012, 2013, 2015, or 2017. Also, you can profile unit tests quickly when working with ReSharper.
dotMemory Unit
Take advantage of the free unit testing framework to write tests that check your code for all kinds of memory issues. Extend your .NET unit testing framework with the functionality of a memory profiler!