
JetBrains DotTrace
OPTIMIZE .NET APPLICATIONS
dotTrace helps you detect performance bottlenecks in a variety of .NET and .NET Core applications: WPF and Universal Windows Platform, ASP.NET, Windows services, WCF services, and unit tests. Mono and Unity applications are supported as well.
Analyze any performance issues
Get accurate data on calls execution time. In the timeline profiling mode, get the same call time data but bound to a timeline. Use timeline data to analyze performance issues where the order of events matters, such as UI freezes, excessive garbage collection, uneven workload distribution, inefficient file I/O, and others.

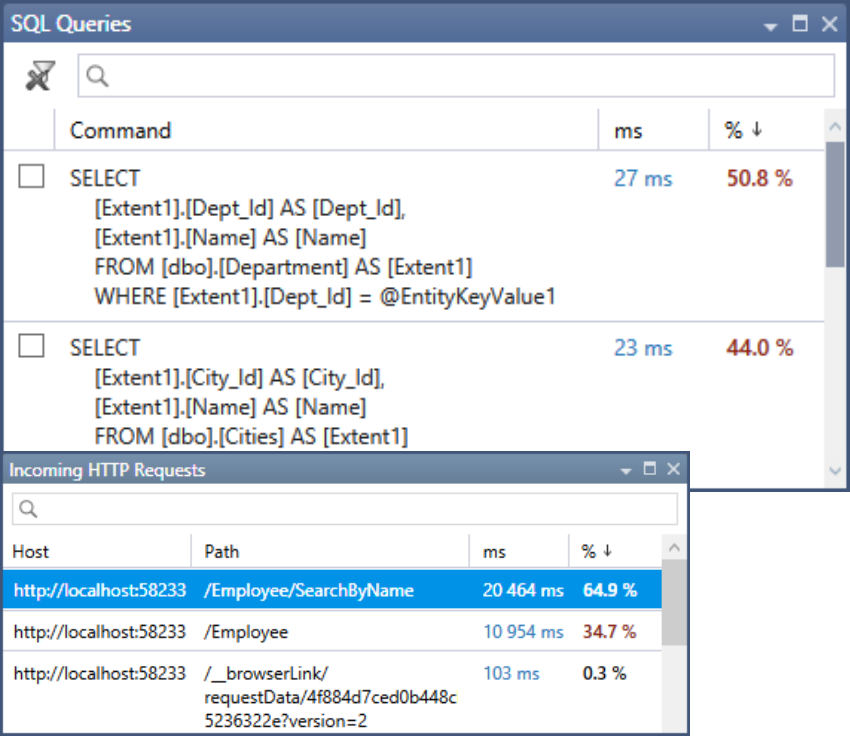
Profile SQL queries and HTTP requests
Find out how a particular query affects application performance and why this query is running slow.
If you develop a web application, learn how it processes incoming HTTP requests.
Click here to reach us
Profile static methods and unit tests
You can instantly get comprehensive profiling data without having to build your solution, run the profiler and perform a usage scenario. Just add a static method alongside the code that you’re optimizing, and profile it!
If you employ unit testing in your project, dotTrace helps you profile any test in just a few clicks. In addition, dotTrace offers a special TeamCity plugin which you can use to profile integration tests on your CI server and prevent performance regressions.

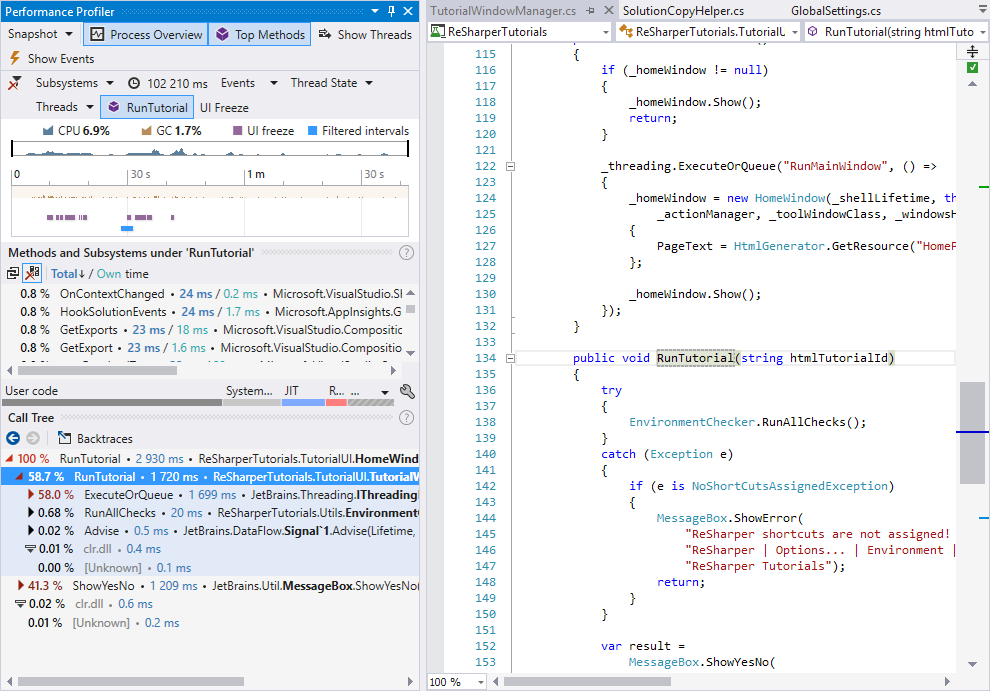
Profile and analyze results right in Visual Studio
With dotTrace you can profile, view performance timelines, analyze call stacks, and perform many more profiling actions without leaving your IDE.
You can even navigate to a method declaration from a hot spot in the call tree!
Click here to reach us